ARCHITECTURE &
ENGINEERING

M.Sc. School Project, Bronx
Year: 2nd year Master
Group work
Location: Bronx
Building a predictive model using computer vision to estimate the urban heat island effect, and its impacts on vulnerable communities.

How do two factors of the urban heat island effect; open-sky-index and amount of green infrastructure, coincide in different sections of the Bronx? Moreover, might this disproportionately impact already vulnerable populations?
Research question

Motivation
Our idea
-
We wanted to see if there was a connection between socioeconomic status and dangers presented by the urban heat island effect.
City information
-
Bronx has a long history of discrimination and it is an older urban landscape which often don’t satisfy modern standards.
Outcome
-
Our results should provide an idea of whether the data readily available points toward a disproportionate effect of the urban heat island on different socioeconomic classes.
-
It is an anthropogenic climate modification in which the urban air temperature is higher than the rural or surrounding air temperature on average.*
-
The urban heat island effect is caused by many factors and their complex interactions, it is influenced by the geometry of street canyons, trees on the streets, building blocks and impervious coverage of the ground.
-
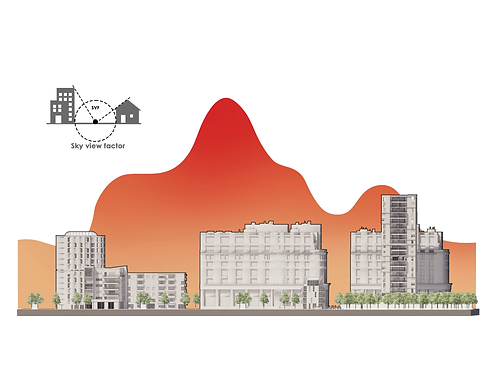
Researching the sky view factor, amount of greenery and blocking effect of the building blocks is the best way to describe the geometrical condition of the urban morphology.
Heat Island Effect
Bowler, D. E., Buyung-Ali, L., Knight, T. M., & Pullin, A. S. (2010). Urban greening to cool towns and cities: A systematic review of the empirical evidence. Landscape and Urban Planning
Oke, T. R. “Canyon Geometry and the Nocturnal Urban Heat Island: Comparison of Scale Model and Field Observations.” Journal of Climatology.

Data Sources
Methodology: Data Fetching
-
Download Census demographic data (Table DP05)
-
Download Census income data (Table DP03)
-
Decide which columns to use from each dataset
-
Drop records with invalid values
-
Join the datasets on the FIPS columns by code
-
Save merged data (.csv)
-
Download census geographic data filtered only Bronx records with code
-
Use geographic data to fetch images for every tract
Strategy formed based on:
https://www.kaggle.com/datasets/muonneutrino/new-york-city-census-data
Census data obtained from: https://data.census.gov/cedsci/table
Methodology: Street Network Parsing

Download street network for each tract with Open Street Network
361 tracts in the Bronx
of which 338 has corresponding demographics data
Generate request points
Flatten the network and select points at 50 meter intervals
Get panorama metadata for 8 randomly sampled points from each tract
8 x 361 = 3.688 points in total
8 points because of Google API limits
Download two images for each heading one facing upwards at a 45°angle (sky) and the other at 20° (green)
3688 x (2x4) = 29.504
Google API daily limit is 30.000
Methodology: Image Segmentation
Methodology: Image Segmentation
Once we have a set of points, we have
utilized the Google API and determined
the panorama ID for each of these points
from the latitude and longitude values for
each point. The methodology we followed
to obtain a set of images for each point is
largely based on the prior works of Gong
et al. ( Gong , 2018) which we modified
to better suit our needs. For each point we have requested four images each with a
horizontal field of view of 90 degrees, thus
completing a full panorama for each point.
For our analysis for greenery, we have
used a pitch of 20 degrees to account for
large trees and capture as much greenery
as possible and for the sky view index, we
have used a pitch of 45 degrees, in order
to make sure we capture the entirety of the
visible sky area, including the apex, at each
point
In order to analyze each of these images
and quantify the total ratios of visible sky
and greenery at each point we have used a
pre-trained Deeplab V3 network provided
by the Senseable City Lab in MIT. Thus, we
have obtained the cumulative values of the visible sky and greenery ratios at each point.
Urban Vegetation
Sky view factor


Demographic Insights

Median Household Income

Percentage of Green Elements and Sky View

Simple Heat Island Effect Risk Index
